Metadata Tables
Nodes and edges tables will contains metadata. When nodes or edges are selected in a Network View, only those nodes/edges will appear in the corresponding tables. Filtering can also be performed using the search toolbar.
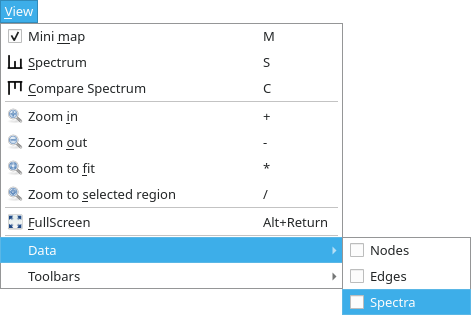
These tables can be hidden/shown using the menu. They can also be moved to a different position in the main window or even detached from the latter by simply dragging it to the new position or double-clicking on it’s title bar.
Note
Columns can be selected via the  right mouse button while the
  left mouse button is used to change ordering.
Default ordering can be reset by right clicking in the empty region on the upper left of the table (left side of the first column and above first line).
Nodes
The nodes table list all nodes and their associated metadata. There is a line per node and a column per metadata type.
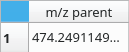
The first column of this table is always m/z parent and contains m/z ratios of ions loaded from the import data dialog.
The second one is reserved to Database search results. This column will contain a list of standards found in the databases (See Databases Query). It is hidden by default and will be visible only if there is at least one results to show.
Nodes Toolbar

The toolbar located on top of the nodes table is divided in three sections.
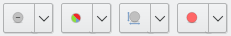
Mapping section
The first section is dedicated to change how nodes are representated in views. Just select one or more metadata column(s), with a right click, then use one these buttons. The dropdown menu include a menu item to undo these changes.
Use data from the selected column as labels for nodes in the views.
Represents the data in the selected columns in the form of pie charts on the nodes.
Adjusts each node size based on the data from the selected column.
Defines color of the nodes from the selected column data.
Nodes section
In this second section, you can interact with nodes and their associated MS/MS spectra:
Highlight in the views the nodes selected in the table. You can then use the Zoom to the selected region function (see View Toolbar) to easily locate these nodes.
Views the MS/MS spectrum associated to the selected node (shortcut S). You can also compare this spectrum to the one associated to a second node using the Compare spectrum function accessible from the dropdown menu (shortcut C). See Spectrum View.
You can try to find similar spectra in databases by using this function. See Databases.
Note
Functions from this section are also accessible from a context menu that will pop up if you right click in a cell of the nodes table.
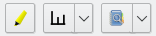
Tools section
The last section defines tools that will end up adding columns to the table:
This tool allows you to create new data columns by combining existing columns using mathematical functions. See Formulae.
This one uses a clustering algorithm (HDBScan) to find clusters in the visualisation and colorize nodes according to. See Cluster.
Not really a tool, but you can use it to remove unwanted columns from the table.
Edges
The edges table list all edges and the nodes they link. This table has meaning only for the classical network view as the other views don’t use edges.
There is a line per edge and the following columns are available:
Source: The first node that the edge link. Source and target are arbitrarily defined and this has no special meaning since the graph is not directed.
Target: The second node that the edge link. Same comment than the Source column.
Delta MZ: Difference of m/z ratio between the parent ions associated to the two nodes. Sign is irrelevant.
Cosine: The similarity score calculated to compare the spectra associated to the two nodes. Value lies between 0 and 1, the higher it is, the closer the spectra are to each other.
Possible interpretation: Possible interpretation of the Delta MZ based on the exact mass.
Edges Toolbar
The toolbar on top the edges table offers a few functions.

- Highlight in the views the edges selected in the table.
 Highlight in the views the nodes connected by the edges selected in the table.
Note
These functions are also accessible from a context menu that will pop up if you right click in a cell of the edges table.
