Network views
Data can be visualised using different views. MetGem offers two types of visualisations:
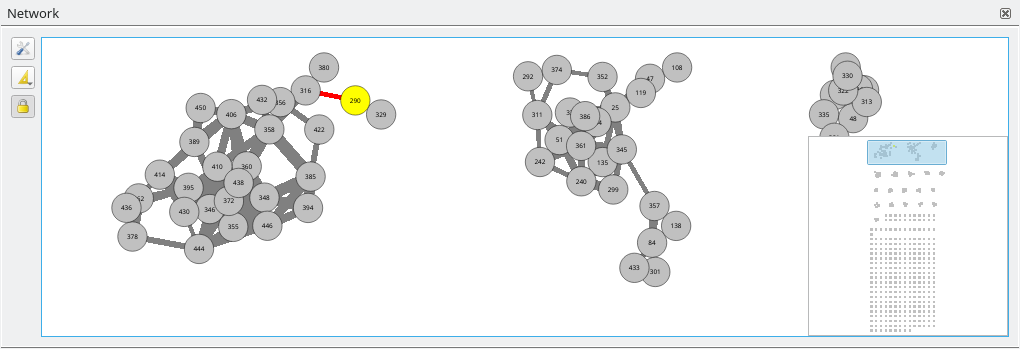
Network: A classical Molecular Network view like what can be obtained by the GNPS platform. In this view, each node represent an MS/MS spectrum and each edge represent a the distance between two nodes (obtained via a modified cosine-score calculation). Distance between clusters is arbitrary and has no special meaning.
t-SNE: t-SNE (t-distributed Stochastic Neighboorhodd Embedding) algorithm tends to preserve local distances and distort global distances. This means that, if two clusters are close to each other in the original space, they have statiscally more chance than distant clusters to be close in the t-SNE projection.
U-MAP: UMAP (Uniform Manifold Approximation and Projection) is a quite new algorithm (2018) which is very similar to t-SNE but claims to preserve both local and most of the global structure in the data.
MDS: MDS (MultiDimensional Scaling) is the algorithm on which t-SNE and UMAP are both based. MDS doest not try to preserve local distances over global distances.
Isomap: Isomap (Isometric mapping) is an extension of the MDS algorithm based on the spectral theory which tries to preserve the geodesic distances in the lower dimension.
PHATE: PHATE (Potential of Heat-diffusion for Affinity-based Trajectory Embedding) is a tool for visualizing high dimensional data. PHATE uses a novel conceptual framework for learning and visualizing the manifold to preserve both local and global distances.
Changed in version 1.3: To make clear that isolated nodes positions are not meaningfull in projections, an horizontal line is drawn between projected nodes and isolated nodes.
Toolbar
 It is possible to change parameters for each visualisation. The visualisation will automatically be re-computed and updated to match the new paramaters.
 If nodes are too close to each other, you can change the scale of the visualisation using the scale that can be found in the dropdown menu
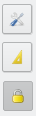
 This option is only available for the classical Molecular Network view. By default, nodes can’t be moved to prevent changing their positions by accident. This function let you unlock the view.
Adding Views
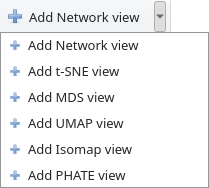
You can add view during the import data process or later by using the  Add View menu in the File Toolbar.
Interaction
Navigation
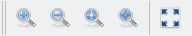
The View Toolbar can be used to zoom  in or
in or  out the active view. You can also use the
  mouse wheel to zoom in or out.
The  Zoom to fit button will reset the zoom to fit all the visible nodes inside the view.
If at least one node is selected, the  Zoom to the selected region will adjust the zoom level to fit the selected nodes inside the view. This can be helpfull to easily locate nodes selected from the Nodes nodes metadata table.
Note
Aspect of nodes and edges depends on the zooming level. At lower level of zoom, nodes text, pie charts and edges are not rendered.
Minimap
The minimap, located on bottom-right edge of each visualisation, gives you a overview of the global representation. It can be used to navigate trough the whole visualisation in two different ways when the :
Left click anywhere in the minimap (outside of the light blue rectangle), the global view will immediately be centered on the selected point.
The minimap can be hidden by hitting the M key on active view.
Selection
Selection can be done with left click on a node/edge or by selecting a region with  right mouse button. Selected nodes turn yellow while selected edges are highlighted in red.
Multiple selections can also be made by holding down the Ctrl key while left-clicking the selection.
right mouse button. Selected nodes turn yellow while selected edges are highlighted in red.
Multiple selections can also be made by holding down the Ctrl key while left-clicking the selection.
Another way to select nodes is the  Select neighbors button in the Network Toolbar.
Selecting nodes or edges will automatically filter metadata tables to show only metadata from selected nodes/edges (See Metadata Tables).
By default, selection is linked between view, i.e. when a node is selected in a view, the corresponding node is automatically selected in all other views. This is usefull to see correspondances between views. This behavior can be deactivated using the  Link selection between views button from the Network Toolbar.
View MS/MS spectrum
When a node is selected, the MS/MS spectrum it represents can be loaded in the Spectrum View (See Spectrum View).
Nodes visibility
Selected nodes and edges can be temporarily hidden using the  Hide selected nodes and edges button from the Network Toolbar. Bring them back using the
  Show all button and edges button.
Sometimes you may want to hide isolated nodes because they are not really informative and they use a lot of space in the screen. This is a job for Clyde, our cute little ghost standing on the  Show/hide isolated nodes button!
Mappings
Nodes metadata can be used to modify how the nodes will look like (See Mapping section). It is also possible to bypass these mappings:
Set the color of the selected node(s). You can use the current color (visible on the top-left corner of the button) or choose another color using dropdown window.
Adjust size for the selected nodes(s). Select the desired size using the dropdown menu or type it in the text box. Default node size is 30.
If you added pie charts to nodes, you might want to temporarily disable them. The  Hide Pie Charts button will be of great help in this task.
Navigate between views
You have two options to navigate between network views: either click inside a view or use the Ctrl + Tab shortcut. Current view will have a light blue outline.
Keyboard shortcuts
All these shortcuts apply to the active view.
Shortcut |
Description |
|---|---|
M |
Show/hide the Minimap |
S |
Show the spectrum associated to the selected node in the Spectrum View |
C |
Compare the spectrum associated to the selected node to another one in the Spectrum View |
Ctrl + C |
Copy as image the visible part of the active view to the clipboard |
Ctrl + Shift + C |
Copy as image the full active view to the clipboard |
